Metrics and Evaluation
Assuming we have the ground truth labels (necessary for supervised learning) we can use multiple evaluation metrics. In general they can be grouped into 3 categories based on what they compare:
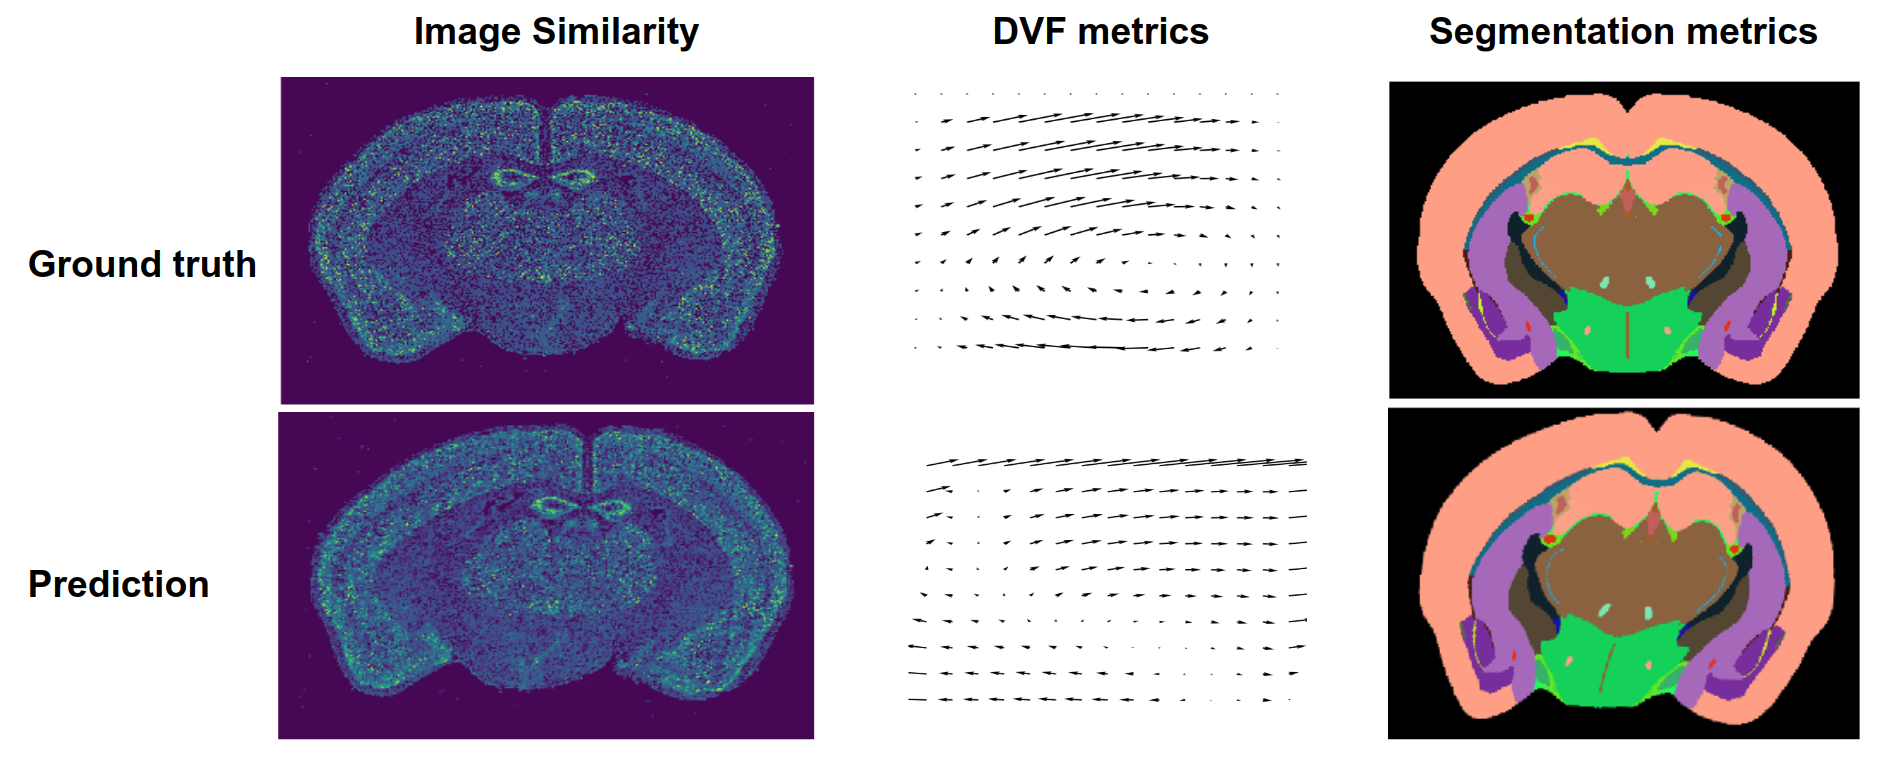
Image similarity
Displacement field
Segmentation
All these metrics are implemented in atlalign.metrics. A subset of them is also available as drop-in
losses for deep learning in atlalign.ml_utils.losses.
The following sub-sections list the available metrics in each of the three categories.
They are all part of the atlalign.metrics module and have a common interface:
atlalign.metrics.<metric_name>(y_true, y_pred, **kwargs)
The parameters y_true and y_pred are pairs of images, displacement fields,
or segmentation maps. Multiple pairs of images can be processed at once by stacking
them along the first dimension, so that y_true and y_pred have the shape
(n_images, ...).
Some metrics have optional keyword arguments that differ from metric to metric, the API reference for more details.
Image Similarity Metrics
Loss-like (the smaller the better):
mse_img– mean squared errormae_img– mean absolute errordemons_img– ANTsPy’s demons metricperceptual_loss_img– perceptual loss
Similarity-like (the higher the better):
psnr_img– peak signal to noise ratio (max = infinity)cross_correlation_img– image cross correlation (max = 1)ssmi_img– structural similarity (max = 1)mi_img– mutual information (max = mutual information with itself)
Displacement Field Metrics
correlation_combined– combined version of correlationmae_combined– combined version of mean absolute errormse_combined– combined version of mean squared errorr2_combined– combined version of r2vector_distance_combined– combined version of vector distance
Segmentation Metrics
iou_score– intersection over union (between 0 and 1, the higher the better)dice_score– dice score (between 0 and 1, the higher the better)
Compute Many Metrics at Once
To get a comprehensive overview of how specific model performs, we implemented a utility function
atlalign.metrics.evaluate that computes multiple metrics at the same time and returns the results
in a pandas.DataFrame.
import numpy as np

from atlalign.metrics import evaluate

n_samples = 5
shape = (320, 456)

y_true = np.random.randint(0, 20, size=(n_samples, *shape, 2))
y_pred = np.random.randint(0, 20, size=(n_samples, *shape, 2))

imgs_mov = np.random.random((n_samples, *shape))
img_ids = np.array(range(n_samples))
dataset_ids = np.array(range(n_samples))
ps = np.linspace(0, 12200, num=n_samples).astype('int')

_, res_df = evaluate(y_true,
                     y_pred,
                     imgs_mov=imgs_mov,
                     img_ids=img_ids,
                     ps=ps,
                     dataset_ids=dataset_ids,
                     depths=(1, 2, 3, 4, 5))

print(res_df.columns)
Index(['angular_error_a', 'cross_correlation_img_a', 'dataset_id',
       'iou_depth_1', 'iou_depth_2', 'iou_depth_3', 'iou_depth_4',
       'iou_depth_5', 'jacobian_nonpositive_pixels_a',
       'jacobian_nonpositive_pixels_perc_a', 'mae_img_a', 'mi_img_a',
       'mse_img_a', 'norm_a', 'p', 'psnr_img_a', 'ssmi_img_a',
       'vector_distance_a'],
      dtype='object')